23
Volume1 Issue4
|
N
ews and
E
vents
If thenumber of dentists isgrowing rap-
idly, thisoverwhelmsgrowth in the total
marketplace, and theaveragepractice
shrinks. Therearevarious factors at play
inBC.
Market growth
BC’s economy isgrowingat aminiscule
1%per year, yet our growth in full-time
equivalent (FTE) dentists isgrowingat
up to3.8%per year. Thepie isgrowing
slowly, but therearemore slicesbeing
cut, hence, thinner slices. Combinedwith
the trendofmaturepractitionersdelaying
retirement (in somecasesby10ormore
years), it suggestsdecliningpopulation to
dentist ratios inBC for thenext decade.
Greater competition
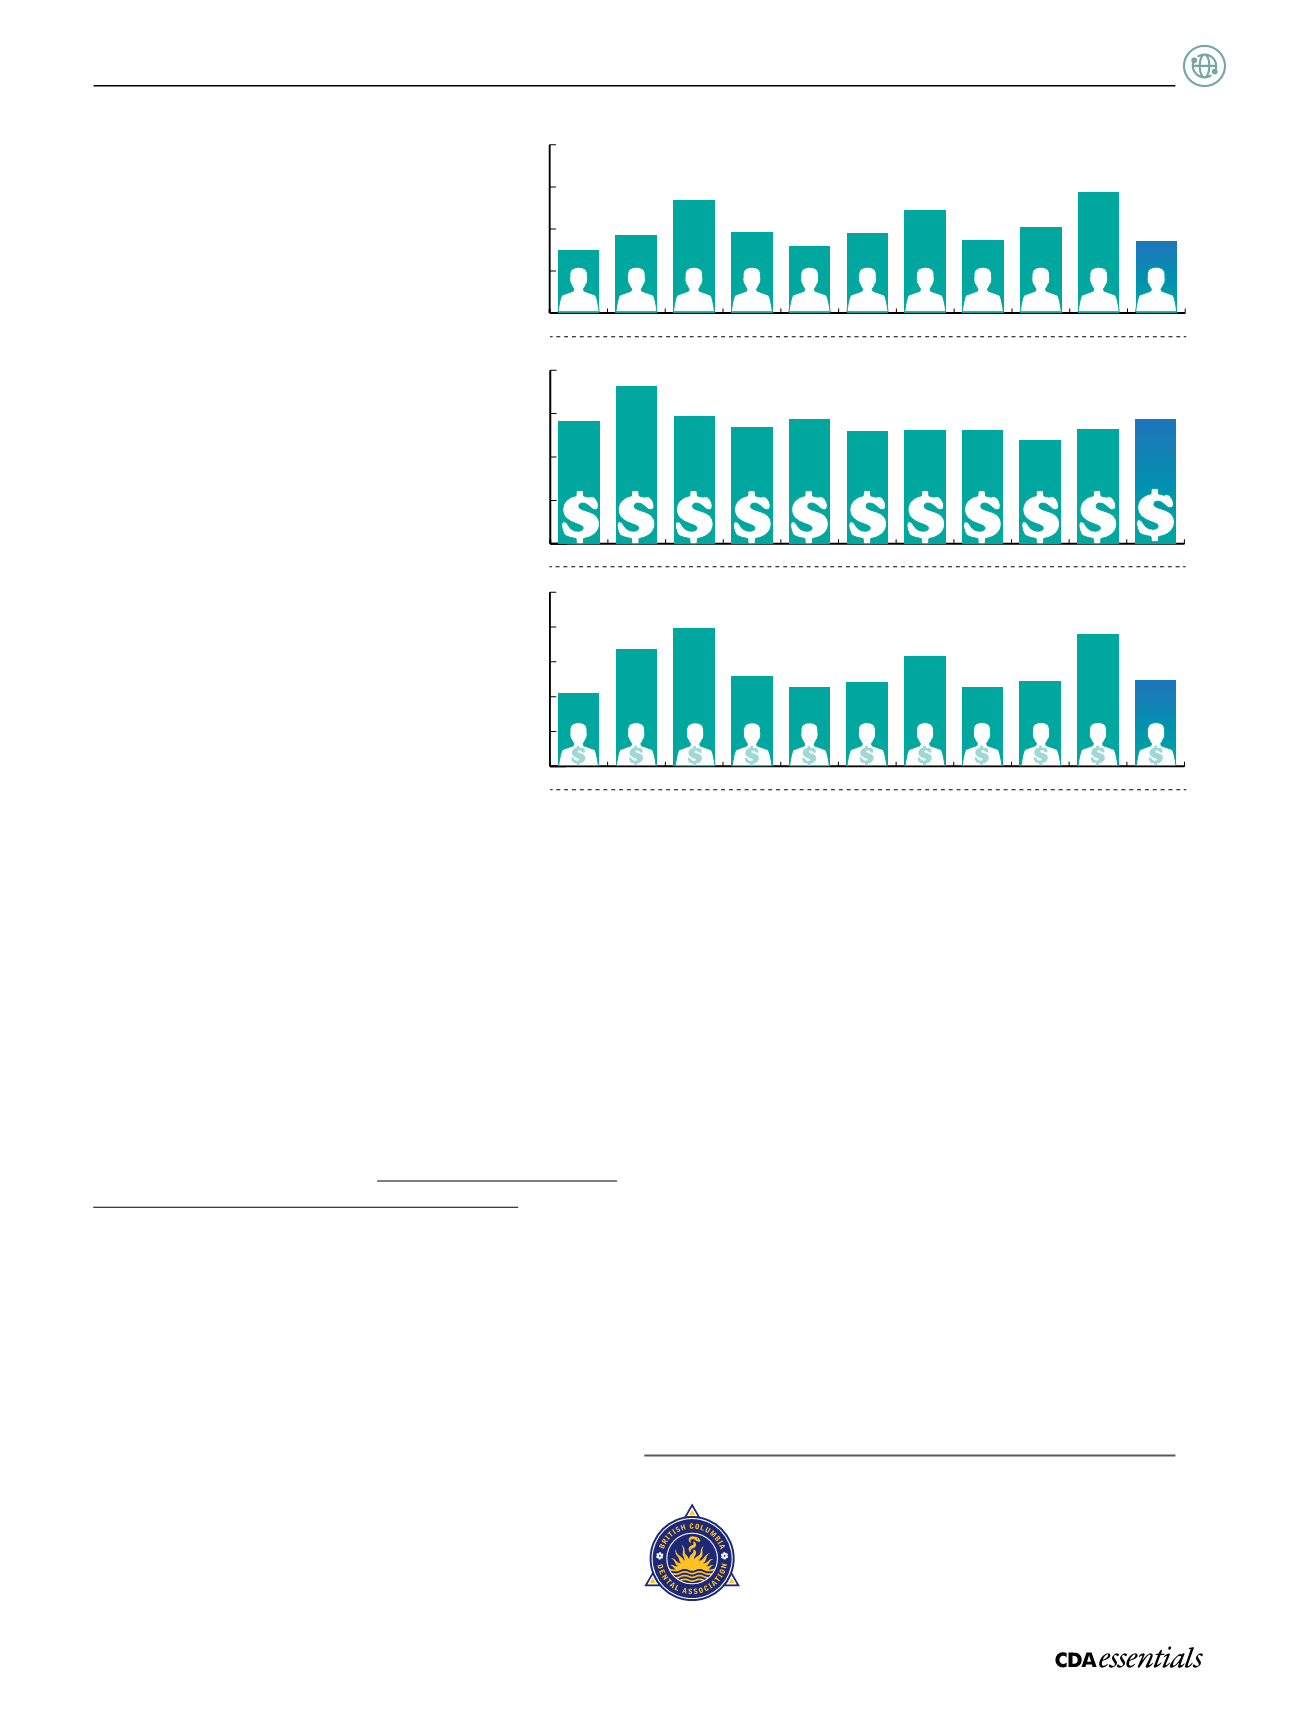
BC isoneof themost competitivemar-
ketplaces inall ofNorthAmerica, not just
Canada.Wehave the lowest “dollar pool”
of all Canadiandentists (
Fig1
)
. If the
increase inFTEs continuesover thenext
10years, aswehave forecast, therewill
beconstant downwardpressureonnet
incomes.
However, there is always a silver lining to
everycloud. The threequartilesof dentists
whoarenot operating like themost efficient quartilehave
theability, throughbettermanagement skills, to runmore
efficiently. Even if thegross incomesof thesepractices con-
tinue todrop theycanmaintainor increase their net income.
Thismeans takingahard lookat expenses. Relyingonwhat
happened in the last 10years tocontinue in thenext 10years
is avery risky strategygoing forward. Thegoodnews is there
aremanyplaces toget themanagement assistanceneeded
to runyour practicemoreefficiently. Onecourse that I am fa-
miliarwith isofferedatUBC
(See:
.
InBC, it looks like thedecreasingpopulation todentist ratio
will persist for thenext 5 to10years, andmanyeconomists
expect slow, uncertainand sluggishgrowth tobe thenew
normal for thenext decade for theeconomiesof theG7
countries, includingCanada.
Spendingondentistry/demand
Per capita spendingondentistry inBC isoneof thehighest,
if not thehighest, inCanada. In2012 therewas adropof
2.6%, representingout of pocket costsor employment
benefits. There isdownwardpressureondental benefits
fromemployerswhichwill further decreaseper capitadental
spendinggoing forward.
0
1000
2000
3000
4000
$0
$10,000
$20,000
$30,000
$40,000
$
$0
$20
$40
$60
$80
$100
b)
PerCapitaDiposable Income
c)
DollarPool ($M) /Dentist
$42.1
$67.3
$51.6
$79.3
$45.6 $48.6
$63.5
$45.5 $49.1
$75.7
$49.2
28,279
36,223
29,485 26,873 28,787
25,851 26,069 26,158 23,970
28,650
26,323
BC
AB
SK
MB
ON
QC
NB
NS
PEI
NL
CA
BC
AB
SK
MB
ON
QC
NB
NS
PEI
NL
CA
BC
AB
SK
MB
ON
QC
NB
NS
PEI
NL
CA
1,490
1,858
2,688
1,920
1,583
1,879
2,435
1,738
2,047
2,875
1,716
a)
PotentialPatients /Dentist
Figure1: a)
Potential patients per dentist ratios
b)
per capitadisposable income
c)
dollar pool
per dentist ratios.
Sources: RKH Economic Consultants Ltd; Statistics Canada Tables 384-00123 and 051-0001; C
anada
HealthCareProviders, 2000 to2009,
Canadian InstituteofHealth Information,October2011
Ifweare right about stagnating total demand, and stagnat-
ingor decreaseddental incomes theneverydentist needs to
ask someor all of the followingquestions:
• What is a safedebt level tocarrybothpersonallyand in
your practice if it takes longer topaydebt off?
• If youareayoungpractitioner, howmuchdoyouwant
topay for apractice thatmayhavediminishingcashflow
going forward from thehistorical cashflow? Theflip side
question to thematuredentist: howmuchcanyou realisti-
callyexpect fromyour practice sale if thenet present value
(NPV) of your practice isgoing todecrease?Howdoes this
affect your retirement plans?
This articleoutlines themagnitudeof the issues facingeco-
nomics committees acrossCanada. However, dentistry is a
caringand rewardingprofession. Iwishyou thebest in2014,
andhope theworldeconomiesget backon trackagain so
our next column ismore fun towrite!
a


