39
Volume1 Issue1
|
S
upporting
Y
our
P
ractice
Abstract
Objectives:
Theavailabilityof dentists as abarrier toaccess tocarehasnot been thoroughly
explored,particularly in largecities. Inthisstudy,weaimedto identifydisparities intheavailability
of dentists in Canada’s largest urban centre, Toronto, and explore whether distributional
disparitiesareassociatedwithunderlying factors, suchasaffordabilityasmeasuredbyaverage
household income.
Methods:
Geocodeddataonnumberof dentistsandpopulationestimates formetropolitan
Toronto’s forward sortationareas (FSA)wereused tocalculatedentistsper100,000population.
Dentist density and average annual household income by FSA were then mapped using
geographic information system techniques. Pearson testingwas used to identify associations
of various factorswithdentistdensity. Significance testingwasperformed tocompareaverage
dentist topopulation ratios inhigh (>$100,000) and low ($40,000–$60,000) incomeFSAs.
Results:
Communitieswithhighhousehold incomesandhighdentistdensitywereclustered
in central Toronto. Income-based disparities in dentist distribution were also observed.
Comparedwith low-income FSAs, dentist density increasedby a factor of 2.47 in thehighest
income FSAs. Dentist density also increasedwith income and educationbut decreasedwith
immigrant level.
Conclusions:
Dentist availability may be linked to demographic factors, including
affordability. The income-baseddisparity inavailability inTorontowasashighas thatobserved
elsewherebetween rural andurbancommunities.
a
Disparities in theAvailability ofDental Care
inMetropolitanToronto
Access the full-text
articleat:
MoreOnline
The following is an abstract of a research article published in the
‘Professional Issues’ section of
jcda.ca
—CDA’s online, open access
scholarly publication that features articles indexed inMedline,
Journal CitationReports and ScienceCitation Index.
AtyubAhmad
MMI,BSc
CarlosQuiñonez
DMD,MSc,PhD,
FRCD(C)
ResearchAbstracts
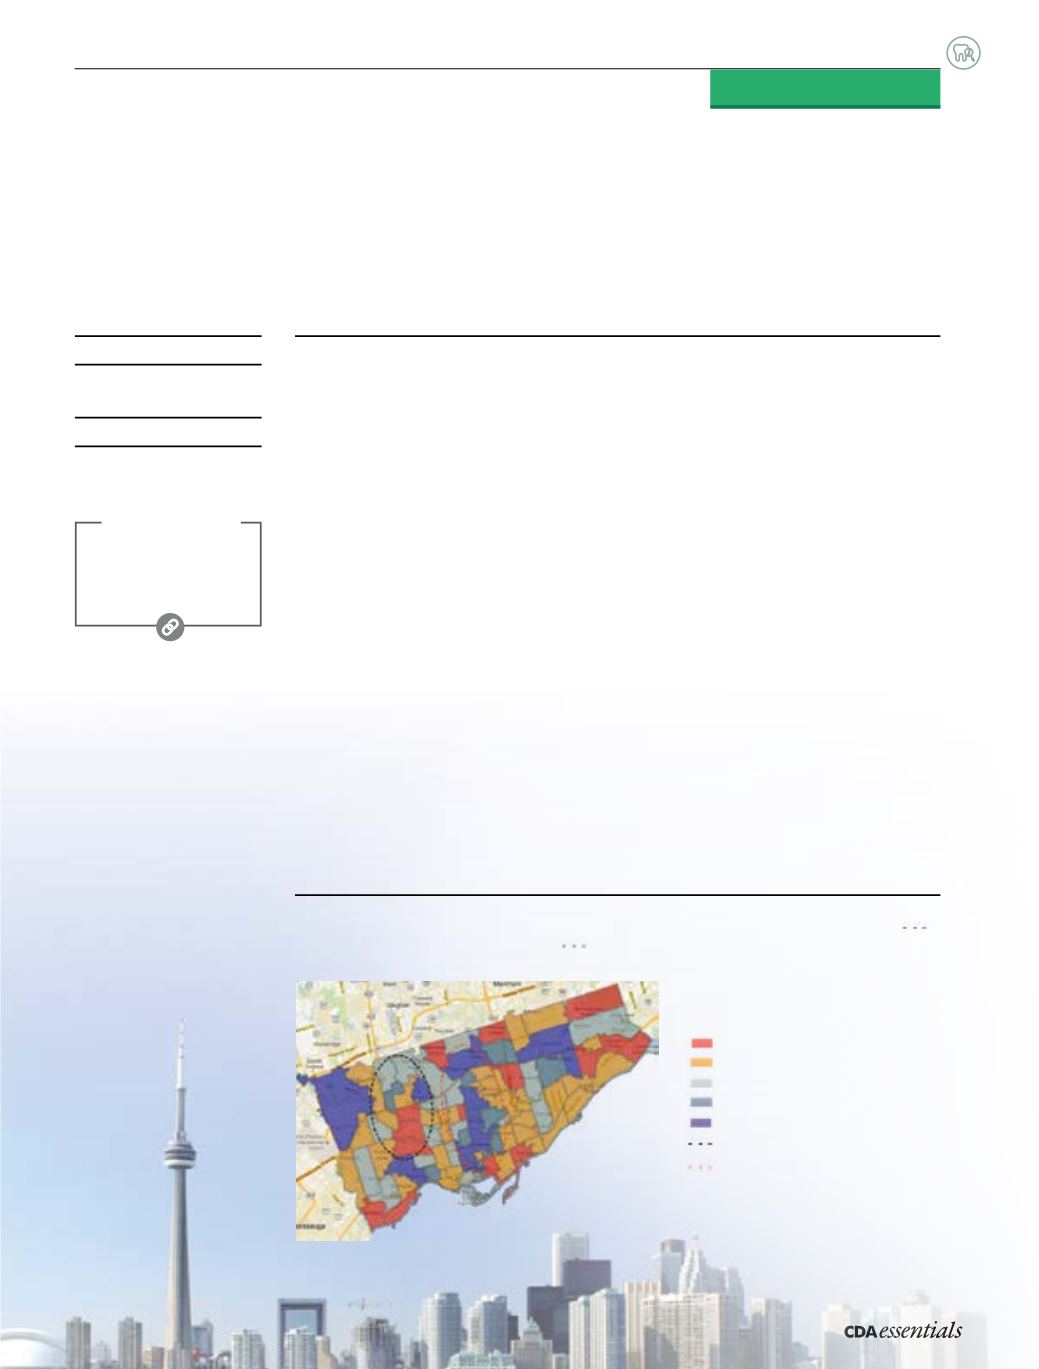
Densityofdentists
(no./100,000)
0 to40
>40 to80
>80 to120
>120 to160
>160
Low-income cluster
High-income cluster
Distributionofdentists (no.per100,000population)across forwardsortationareas in
metropolitanToronto.Areaswithhighaverageannualhousehold incomeareclustered ( )
asare thosewith lowaverage income ( ).


