|
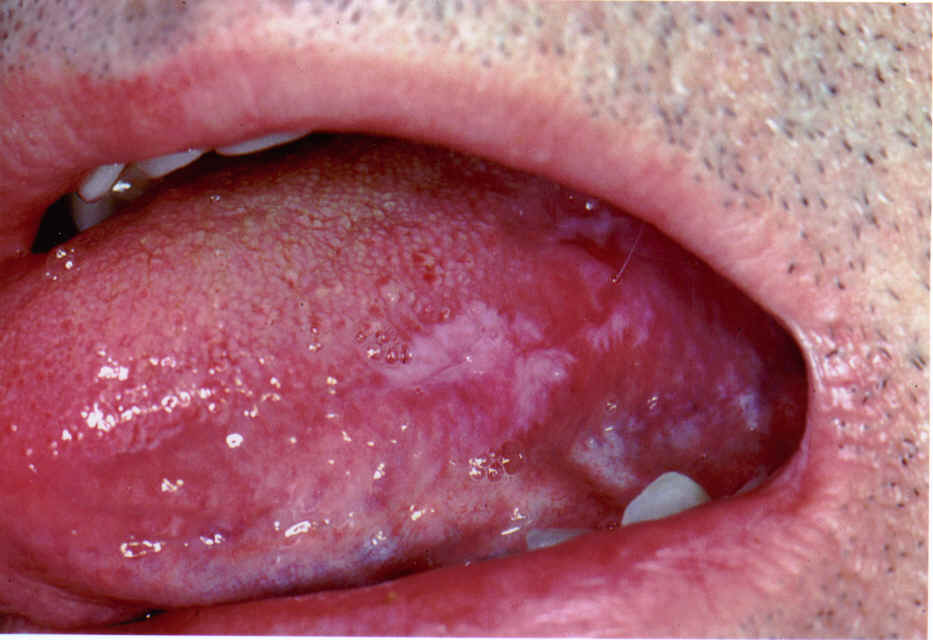
| Figure 1: Squamous-cell carcinoma |
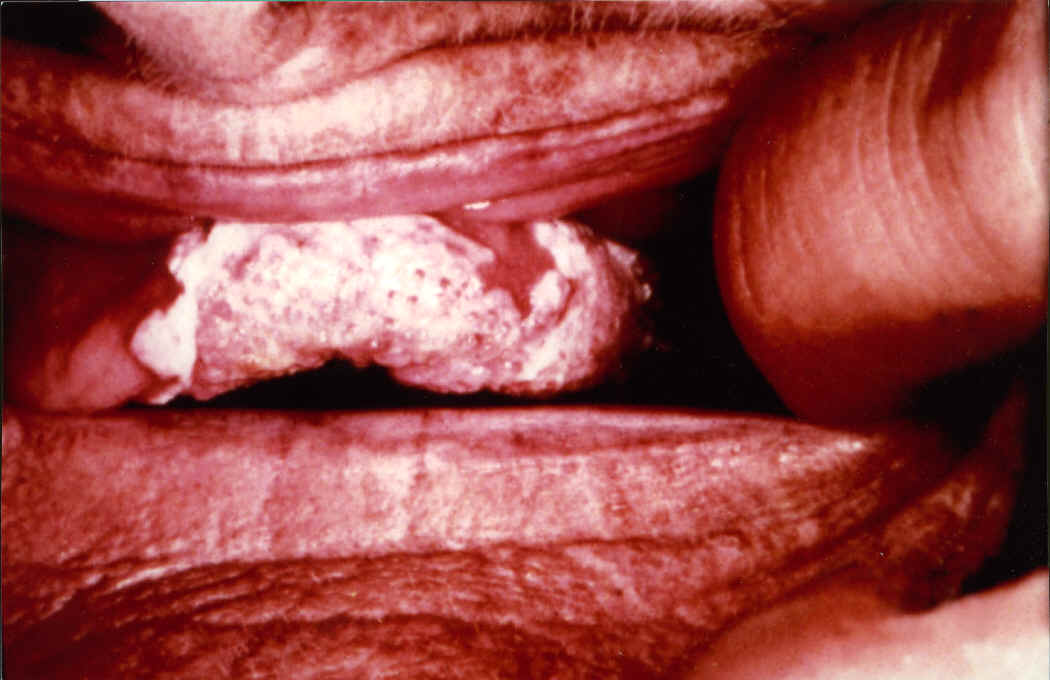 |
| Figure 2: Verrucous carcinoma |
 |
| Figure 3: Diagram of an edentulous mandible showing the high-risk “horseshoe” area for squamous-cell carcinoma (half of the “horseshoe” is shown here). This area extends from tonsillar pillars to the trough of tissue formed by the lateral border of tongue, the floor of the mouth and the lingual gingiva. |
|
 |